Getting Started
Setting up your Job Board account
How to connect Quickbooks Online to the Job Board version
Launch jobs from Orders - Job board version
Job Board Only version Vs Pro version
Setting up your Pro account
Flagging a user as a "Sales Rep"
shopVOX Pro User Types
Forms: Editing the User Interface
How to Change Password
How Do I Create a New User?
What size should my logo be so it can appear in email PDFs?
Account Settings for your Pro account
shopVOX Work Flow - The Big Picture
Roles: How to restrict access for certain users
Protect Your Bottom Line with Terms and Conditions
Transferring data from my old system to shopVOX
POS Settings - General
Outsourced PO PDF - details your Vendors need to know
PDF Settings
How are Users Billed?
Common Questions About Users
How to import your customers and contacts from a spreadsheet
How to configure the SMTP settings for your email
User Roles and Permissions Explained
POS Settings – Sales Taxes
Five challenges to consider when setting up your Account
Adding new customers
shopVOX Pro Job board Filters
Training resources
Pricing
Create your first Pricing Template - a visual guide
What is a product?
shopVOX Pricing Templates
Building a Product: The Basics of Using Pricing Templates
Accounting sync setup
Transaction Number Sequencing
Setup Xero accounting integration
Common QB Questions
shopVOX Setup of Tax Codes for Quickbooks Canada Desktop/Online
How to Connect to Quickbooks Online using the Setup Wizard
How to Connect to Quickbooks Desktop version using the Setup Wizard
How to setup Sage Business Cloud Accounting integration
Getting started Guide
Save Time with Emailed Document Templates
Notifications: Keep your entire team up to date
shopVOX Compatibility
Top 10 flows in shopVOX for a typical shop
Introduction to ShopVOX
How to create a Sales Order
Microsoft Outlook - Two Factor Authentication
Avalara AvaTax - Sales tax setup guide
Sales
Managing Customer and Leads
Managing dates on Quotes, Sales Orders, and Invoices
How to Add a Special Note to a Customer Document ?
How Do I Group Contacts Together?
Customer Alerts & Flags
Inactive Customers Report
How Do I Group Customers Together?
Merge Customers
Adding new Contacts to Existing Customers
Set up different pricing levels for different customers
Update: Editing Existing Contacts - GDPR Compliance
What are Sales Leads?
Sales Lead or straight to Quote?
Sample Sales Lead Pipeline
What is a CRM system?
Win more business with Sales Leads
Why use Sales Leads?
Sales Leads Guide
Create Sales Leads automatically from the contact form on your website
How do I add a Quote from a Sales Lead?
Sales Order States
How to Create a New Sales Lead in shopVOX
How to Create a Quote
Sales goals - Setting up for Success!
Drive results with the Sales - Production Thermometer
Adding Shipping Charges to a Transaction
Quote Approval Email Feature: Adding Attachments
Use the Roll Up feature to combine pricing for multiple line items
Quote States
Adding Images to a Quote/Sales Order/Invoice PDF
What is the Sales Process?
Quote Review - Send Approval Email
How to use the Quick Quote Feature
What is a Sales Pipeline?
Mark invoices as Delivered, Shipped or Picked up
Quoting Screen Printed Apparel
Products & Pricing
Basic Pricing concepts
What are Pricing Types?
Create Your First Product
What is the difference between Standard, Cost+ and Product Pricing?
How do I add a product category?
Pricing Attributes
Materials - Understanding, Adding and Adjusting
Labor Rates and Machine Rates
Shipping, Setup, Finance & Miscellaneous Charges
Building a Product and understanding Pricing Templates. Watch the webinar!
Building Products using Grid Pricing
Pricing products using the Panels UI
Using Variants for different Pricing Structures
Advanced Pricing concepts
Modifying Starter Products: Remove installation and design services if they are not taxable in your area.
Setting up second side pricing for a Product
Vendor Pricing: adding to Materials
Using Logic in your Pricing Templates
How does Wastage work in shopVOX?
Job Costing - Estimated vs. Actual
Modify Material, Labor rate & Machine rate formulas within a Product
Deactivating and Deleting Products
How to make your invoice line items editable
Re-Calculating Bill Of Materials (BOM)
What's the difference between Margin, Markup %, and Markup Multiplier ?
How to adjust the bill of materials (BOM) for situational purposes
No Total PDF: How to give a customer options without totaling the whole Quote
What is the Sell/Buy Ratio?
Customizing Line Item Descriptions
Custom Fields in shopVOX
How to increase prices for your Products by a percentage
Setting up Products priced by the Square Inch
Product: Business Cards using Grid Pricing
Adding Pricing Template to a Grid Product
Problems with Grid Product - Who can I contact for help?
How to Import Grid Pricing from a Spreadsheet ?
What is the difference between range and volume discounts?
How can I give a discount for a product for a single customer?
Grid Pricing Webinar
Examples of Grid Pricing Products
Master Pricing Guide
Production Management
Job Board management
Adding your Job Board to your TV
Why create jobs and use the job board?
How to Generate a Completed Jobs Report
A guide to the Job Board
Job Board - Different Views
Change default job view
Full screen Job Board
Making Job Board Line Items More Unique
How and when to use Create Combined Jobs
Workflow templates
Proofing
How to upload a proof to your job ?
How do I send Multiple versions as options to the customer to choose from?
How do I send several proofs for the different items on my transaction?
Does shopVOX support multiple page proofs?
Get artwork approved faster with Online Proofing
Scheduler
Managing your schedule with the Shop Calendar and Shop Scheduler
Shop Calendar and Shop Scheduler: Overview - is it right for my shop?
Will changes made on an Invoice or Sales Order Line item be updated to the Work Order details?
Is Inventory for Me?
How Do I Require a Payment before a Job can be started?
Using Create Combined Job to group line items for production
What are Projects?
Material Requisitions
Accounting and Reporting
QuickBooks Online
How to export customer data from QuickBooks Online
Quickbooks Online: Common Sync Errors
Automatic Sales Tax Rates and QuickBooks Online
How to Sync to Quickbooks Online
ACH Payment
QuickBooks Desktop
How to export customers & contacts from Quickbooks Desktop?
Quickbooks Desktop: Common Sync Errors
How to Sync to Quickbooks Desktop
Xero
Reports
How to send invoice statements to customers with the Collections report
Daily Sales and Payments report
Daily Activity Report
How to create progress invoices ?
Sales Tax Groups and Combined Tax Rates
MYOB Export & Sage 50 Export
How to refund credit card transactions processed via shopVOX & Authorize.net
Square Payment Integration
Prevent QuickBooks sync errors by excluding special characters and limits
Take in-store credit card payments with a USB credit card swiper
Sales Commission
Line item Taxable / Non-Taxable logic - Video
How Do Credit Memos and Refunds Work in shopVOX?
Differences between USA QuickBooks Online and Non-USA QuickBooks Online
Accounting wins! Strategies for using shopVOX for business growth.
Creating & sending Statements in shopVOX
Sales Tax Rates
Industry Specific Content
Sign Industry
How to Price Vinyl Printing
How to Price Banners
How to Price Banner Stands
Pricing Scenarios: Banners
Product: Yard Signs using Grid Pricing
How to Price Vehicle Wraps
Apparel Industry
Promotional Items: adding Labor cost & Base Product cost to Purchase Orders
Adding your own Variants for Embroidery and Screen Printing
How do I stop the price for my apparel from recalculating when I update the quote or sales order?
How do I add customer supplied garments to a quote or sales order?
Blank Apparel - Integrated Supplier Catalogs
Adding Promotional Products to your Quotes and Sales Orders
Dynamic Size Selection on Apparel UI
Apparel UI - Catalog Pricing Flag
How to add Screen Printed Apparel to Quotes and Sales Orders ?
How to price Screen Printing
How to customize the standard Screen Printing locations
How do I quote multiple options or quantities of shirts or hats?
How to price Screen Printing - case study
How do I add apparel styles that aren't listed in the integrated catalogs?
Importing custom catalogs for apparel from other suppliers
How do I see a detailed breakdown of cost and price of apparel?
How do add additional apparel styles or colors to a quote or sales order?
Apparel Decoration Order Guide
Master Guide to Apparel Decoration
MSRP Catalog pricing - setting a Fixed price for Apparel items
SanMar apparel catalog integration
Automation & Integrations
Shipping
UPS Shipping Integration - Access Keys
FedEx Shipping Integration
Creating a shipment
Shipping Profiles
APIs
shopVOX API
How does an API work?
What is JSON?
Where can my get my shopVOX API credentials?
What is an API?
Can the shopVOX API accept tracking numbers on shipped orders?
Does shopVOX do custom development?
Setting up the Gmail and Outlook Email Integrations with @mail feature
Master Guide to Automation & Integration
How to update your current contact form integration to include uploaded files
What are some popular advantages when using Zapier?
How to add form submissions as Sales Leads in shopVOX
How to send Shopify orders to Sales Orders in shopVOX
shopVOX Go!
How to add Third party Shipping account to a Customer ?
I'm having an issue with the shopVOX APIs. Who do I contact?
How do I build my own custom integration?
Does shopVOX integrate with Salesforce?
Does shopVOX integrate with Microsoft Project?
How Purchase orders work in shopVOX
Setting up Mailchimp integration
Customize your account with Add-on Features
Scheduled Actions - What are they and what can I do with them
API/WebHooks integration feature
Setting up Constant Contact integration
FAQs
shopVOX specific terms
What happens when a Job is completed?
QuickBooks - Classes
Key terms explained
Divisions Add-On
Uploading vs Linking Assets
Why doesn't Material have Volume Discount, only Range Discount?
What does Capacity in Minutes mean?
Common questions
Why can't I print the PDF documents directly, instead of downloading?
How can I print invoices to mail to my customers?
I can't use my email address? shopVOX says email has already been taken.
How do I re-activate the disabled user?
How can I send a quote and a proof together in one email to my customer?
Where do jobs "fit" in the order process in ShopVOX?
What is the Admin checkbox for when creating a new user?
How to Set Up and Use the Inventory Feature
How can I change the workflow template for a job?
How Can I Upload an Image of a Product on a Job Line Item?
Customers- Credit Limits, Stop Supply & Disable
What Does "Group" Mean When Creating a New Customer?
New to Quickbooks While Using ShopVOX
How to increase Database size ?
Hex Color file to match PMS color chart
Can customers download uploaded proofs?
How do I update contact info?
How can I raise a PRO-FORMA or DOWN-PAYMENT Invoice?
How do I add new products?
Can we chat internally with other users?
How to enable login only from static IP address
How can I delete a job?
Who should be assigned the Customer Review step in online proofing?
Opening PDFs directly in your browser
How to hide the thumbnail image in proof emails
What does the number next to workflow steps mean?
Bulk deleting customers
Optimization tips for the Job board
Errors and Troubleshooting
How do I remove / delete materials, material types, or material categories?
When I convert a quote to a work order, does the name of the order and the line item description carry forward or do I have to rewrite?
shopVOX Chat Feature not working on Firefox Browser
How to clear history from Chrome browser?
Flags to control what prints on customer facing vs internal PDFs
Keep Important Documents Handy with Account Level Assets
How to round your pricing to 2 decimals or 4 decimals
ERROR - Property: amount_in_cents, reason: greater than payment balance.
Control custom line items
Existing Approved Proofs for ReOrders
Advanced Search & Filters
How do I cancel my account?
Powerful Global Search in shopVOX
How can I setup a minimum order amount?
How to optimize your browser for shopVOX
Unable to change the Customer on Order ?
Asset Images and using Image Notes
What is our IP address for the mail server ?
Custom PDF in shopVOX
shopVOX Job Board version
eCommerce
Taking Payments in ShopVOX - what your customers will see
Setup a private storefront for your clients to place orders with a cPortal
How do I enable the free cPortal for a customer?
What is the difference between the Paid and Free versions of cPortal?
Online Ordering Account settings for cPortals & Shopping Cart
How is online payment processing set up?
Webstore & Shopping Cart Examples from shopVOX Users
Webstores for your customers - What are they? and... How to setup!
How to setup Products for a given customer to be able to order from cPortal?
White Label setup instructions
Steps to setup custom URL for paid cPortal
Setting up a Shopping Cart to sell online
What will my customers see on their cPortal?
Webstore vs Shopping Cart
How to create a Discount Code in the eCommerce feature
- All Categories
- Sales
- Drive results with the Sales - Production Thermometer
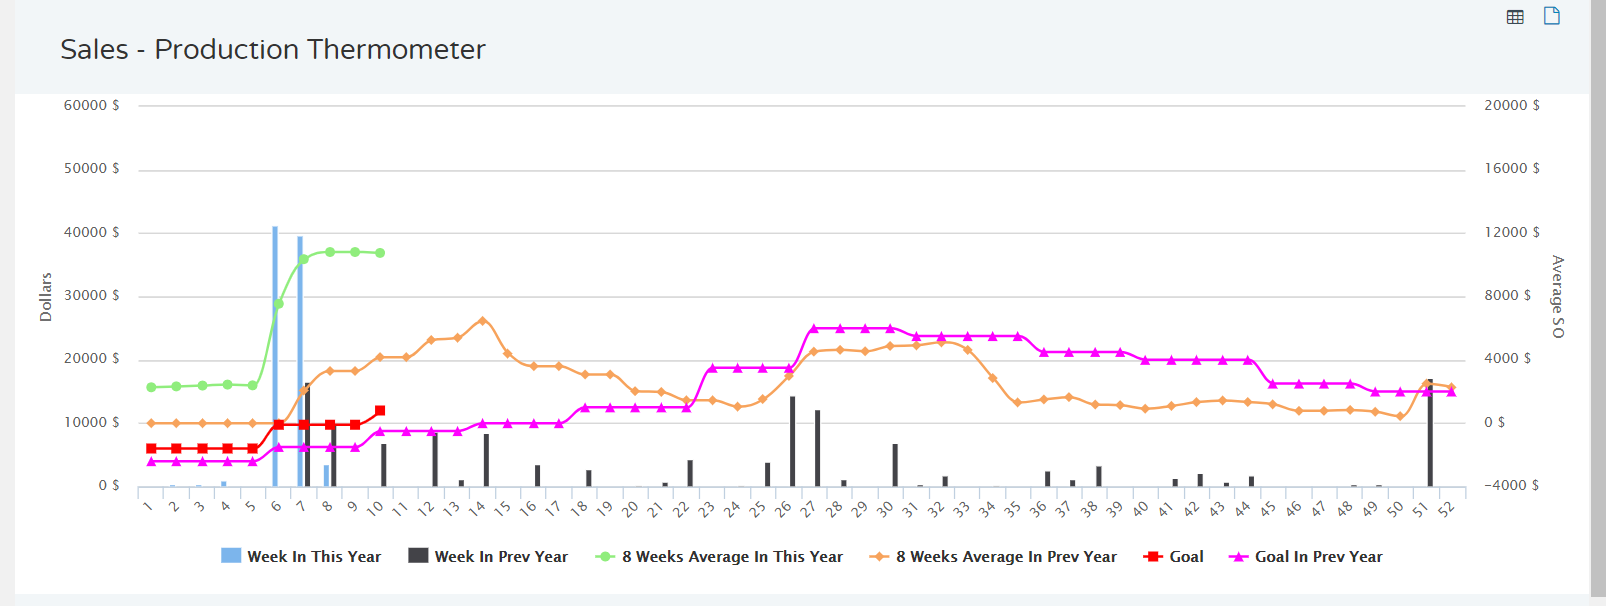
Drive results with the Sales - Production Thermometer
 Updated
by Santosh
Updated
by Santosh
As an owner or manager it can be tough to know what actions to take when reviewing your data. Our Sales - Production Thermometer dashboard makes it simple to analyze your key numbers and know where to focus your attention.
Sales - Production Thermometer dashboard
Determine Your Goals
To get value from the Sales - Production Thermometer, you'll want to set up your Sales Goals for the current year.
How much revenue do you want to generate on a monthly basis?
When setting your monthly sales target, it's best to have your historical data on hand. Use your monthly sales for the last year as a baseline for setting targets for the current year.
If you're currently selling an average of $30,000 worth of signs or apparel on a monthly basis, closing $100,000 in sales next month is a big jump. It's important that your goals are achievable so your team stays motivated.
Don't forget to think about your profit margin and monthly overhead expenses when determining your sales target.
Add your Monthly Sales Target

- Go to POS Settings > Sales Goals
- Select the current year and click Go
- Input your targets for each month by Sales Rep or Store
Calculating Your Numbers
Find Your Conversion Ratio
What percentage of quotes do you close and convert into sales orders?

- Click the Home icon
- Click Business Intelligence
- Adjust the date range to the previous financial year
- Write down this number
Calculate Your Monthly Quote Target
Your quote target is how much you need to quote in a given month to hit your sales target. You'll use the conversion ratio from the previous step to calculate it.
Here's the formula on how to calculate your quoting target.
Monthly Sales Target / Conversion Ratio = Quoting Target

$30,000 / .562 = $53,571.43 or $54,000 (rounded up to nearest thousand $)
- Use the formula above to calculate your monthly Quote Target
- Write down this number
Now you're ready to use the Sales - Production Thermometer.
Reading the Report
It is important to understand how the report is structured before you take action on the data.
Sales Growth Summary

This summary shows your Sales Order $ totals and growth year over year.
The weekly average is a great way for you tell if you're on track to beat last years sales numbers. You want the weekly average for this year to be higher than last year.
Sales Growth Detail
The Sales Growth Detail section is broken down into the individual 52 weeks of the year.
There are two columns so you can easy compare this years performance to last years.

Here's what the sub-columns mean.
- Quotes total - The total $ value of all quotes created in the week
- Sales Order total - The total $ value of all sales orders created in the week
- Invoices total - The total $ value of all invoices created in the week
- 8 Week SO Avg - The running average of the total $ value of sales orders created in the last 8 weeks
- Goals -
The weekly target for the total $ value of all sales orders created in the week.
Now let's learn how to use this report to help your shop be more successful.
Taking Action on the Data
Are we writing enough Quotes?

If your weekly sales order goal is $13,000 and your average conversion ratio is 60%, then you'll need to generate at least $13,000 / .60 = $21,666.67 of quotes to hit your sales target.
If you see that your Quote total is less than this number, then you need to start writing some quotes.
Here's a few ideas.
- Set aside 3-4 hrs to call your existing customers and ask them what projects they have coming up
- Ask any customers that come to pick up orders this week for a referral
- Ask your sales reps if there are any projects that they've not gotten around to quoting
Common Questions
When should I review the Sales - Production Thermometer?
We recommend you incorporate this into your weekly routine. Put a recurring event on your calendar for 30 min every Monday morning or Friday afternoon.
Why do Goals show in red or green?
Numbers in Red are sales that are below set Goals
Numbers in Green are sales that are above set Goals
